


AverageExplorer: Interactive Exploration and Alignment of Visual Data Collections
Abstract
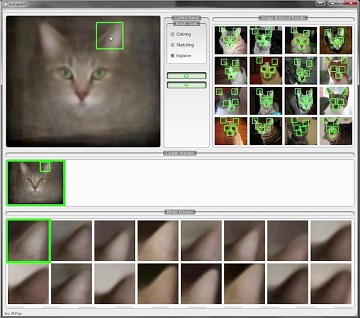
This paper proposes an interactive framework that allows a user to rapidly explore and visualize a large image collection using the medium of average images. Average images have been gaining popularity as means of artistic expression and data visualization, but the creation of compelling examples is a surprisingly laborious and manual process. Our interactive, real-time system provides a way to summarize large amounts of visual data by weighted average(s) of an image collection, with the weights reflecting user-indicated importance. The aim is to capture not just the mean of the distribution, but a set of modes discovered via interactive exploration. We pose this exploration in terms of a user interactively “editing” the average image using various types of strokes, brushes and warps, similar to a normal image editor, with each user interaction providing a new constraint to update the average. New weighted averages can be spawned and edited either individually or jointly. Together, these tools allow the user to simultaneously perform two fundamental operations on visual data: user-guided clustering and user-guided alignment, within the same framework. We show that our system is useful for various computer vision and graphics applications
Citation
Jun-Yan Zhu, Yong Jae Lee, and Alexei A. Efros. "AverageExplorer: Interactive Exploration and Alignment of Visual Data Collections". ACM Transactions on Graphics (SIGGRAPH 2014), 33(4), July 2014.
Supplemental Material